
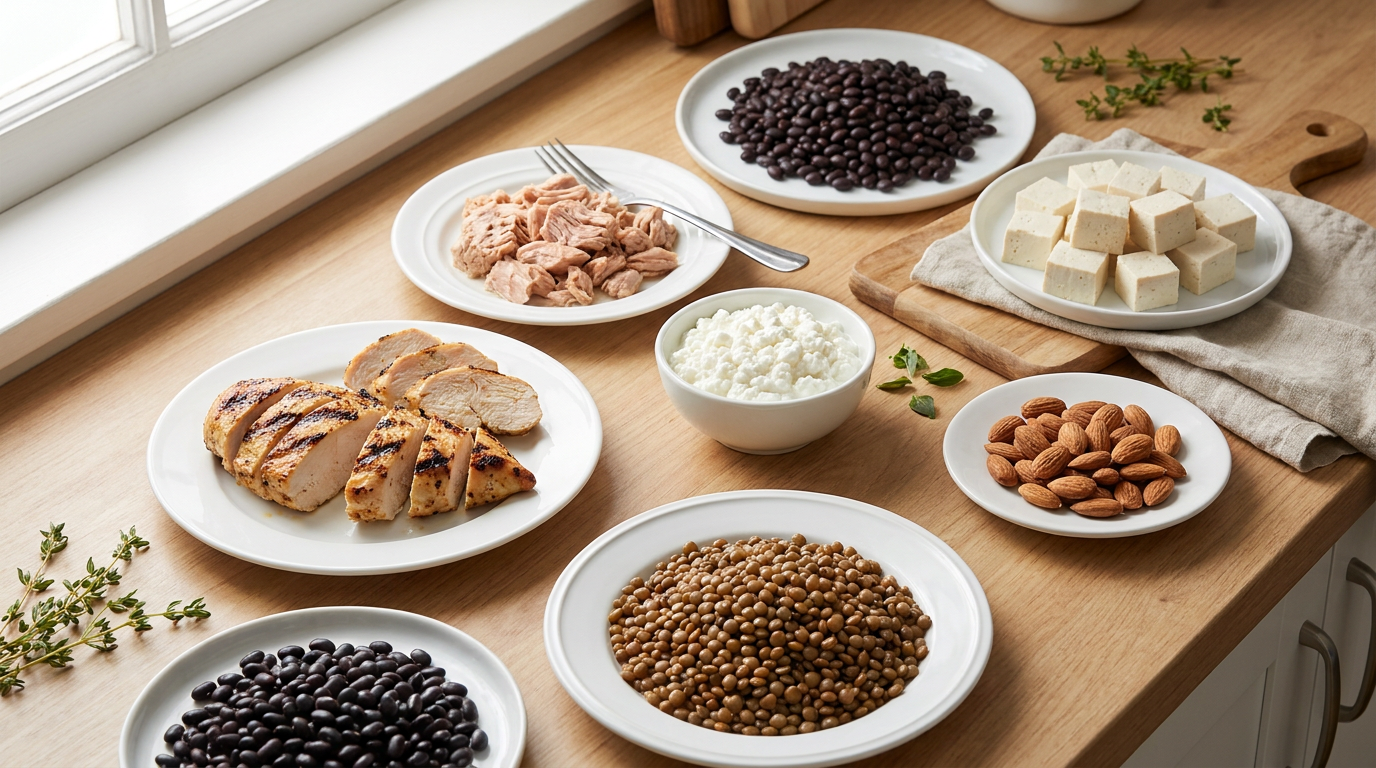
Ranked by grams of protein in a typical serving, the top 10 protein foods are canned light tuna at 32.0 g per drained can, roasted chicken breast at 26.7 g per half breast, 2% cottage cheese at 24.2 g per cup, 93% lean ground beef at 22.3 g per 3 oz patty, firm tofu at 21.8 g per half cup, cooked lentils at 17.9 g per cup, nonfat Greek yogurt at 17.3 g per container, cooked black beans at 15.2 g per cup, peanut butter at 7.1 g per 2 tbsp and almonds at 6.0 g per ounce.
Every figure comes from USDA FoodData Central. The per-serving column is the USDA per-100 g value scaled to the USDA portion weight for that same food, so you can check the arithmetic yourself.
The two rankings disagree, and that is the whole point
Most lists pick one basis and never say which. Peanut butter carries 22.2 g of protein per 100 g, which beats canned tuna at 19.4 g. Nobody eats 100 g of peanut butter.
USDA puts a serving at 2 tablespoons, or 32 g. That drops peanut butter to 7.1 g and sends it near the bottom.
Cottage cheese runs the opposite way. At 11.0 g per 100 g it looks ordinary, but a cup weighs 220 g, so it finishes third at 24.2 g per serving.
Both columns carry a limit worth stating out loud. USDA portion weights are database conventions rather than eating habits, and half a breast or two level tablespoons of peanut butter is less than most people actually put on a plate. Read the serving column as a floor, not a promise.
Video: Yatinder Singh
Animal sources, both bases side by side
| Food (USDA description) | Protein per 100 g | USDA portion | Protein per portion |
|---|---|---|---|
| Chicken breast, meat only, roasted | 31.0 g | Half breast, 86 g | 26.7 g |
| Beef, ground, 93% lean, patty, broiled | 26.2 g | 3 oz, 85 g | 22.3 g |
| Tuna, light, canned in water, drained | 19.4 g | 1 can, 165 g | 32.0 g |
| Cottage cheese, lowfat, 2% milkfat | 11.0 g | 1 cup, 220 g | 24.2 g |
| Yogurt, Greek, plain, nonfat | 10.2 g | 1 container, 170 g | 17.3 g |
Chicken breast wins per 100 g and loses per serving, because a drained can of tuna is simply a bigger pile of food than half a breast. Eggs missed the cut at 12.6 g per 100 g and 6.3 g for one large egg.
Plant sources, same treatment
| Food (USDA description) | Protein per 100 g | USDA portion | Protein per portion |
|---|---|---|---|
| Peanut butter, smooth style | 22.2 g | 2 tbsp, 32 g | 7.1 g |
| Almonds, raw | 21.2 g | 1 oz, 23 kernels, 28 g | 6.0 g |
| Tofu, raw, firm, calcium sulfate set | 17.3 g | Half cup, 126 g | 21.8 g |
| Lentils, cooked, boiled | 9.02 g | 1 cup, 198 g | 17.9 g |
| Black beans, cooked, boiled | 8.86 g | 1 cup, 172 g | 15.2 g |
Firm tofu is the only plant food here that holds its place on both bases. Cooked quinoa gets called a protein grain constantly and sits at 4.4 g per 100 g, or 8.1 g for a full cup, which is under a single container of Greek yogurt.
Where packaged protein lands against raw food
Raw ingredients set the baseline, and packaged products are judged against it. Reading the label on high protein snacks sold in stores next to these numbers shows how much of a bar or pouch is actually protein by weight.
Whey protein isolate concentrates protein past any whole food here, while a bag of protein chips sits closer to the almond end once you weigh the portion. This is general nutrition information, not dietary advice for a medical condition.
Common questions about ranking protein foods
Which food has the most protein per 100 grams?
Of the 10 here, roasted chicken breast at 31.0 g per 100 g, followed by 93% lean ground beef at 26.2 g. Peanut butter at 22.2 g leads the plant column.
Why do per-serving numbers change the order so much?
Portion weights range from 28 g of almonds to 220 g of cottage cheese. A food eaten in a large portion climbs even when its density is low.
Are cooked and raw figures interchangeable?
No. Cooking drives off water and concentrates protein by weight, so the USDA lists cooked and raw entries separately. Every figure above uses the state you would eat the food in.